
The holy grail of 100% renewable electricity for Australia finally appears to be within reach after the premier of the Australian state of Queensland recently announced her government’s ambitious energy and jobs plan.
Such an achievement would be a major milestone in reducing global emissions to levels agreed at the Paris Accord. But why would Australia achieving 100% renewable electricity be considered a milestone if it contributes only around 1 to 2% of global emissions?
First, Australia’s per capita emission rate is in the top three world-wide of large scale economies, bestowing a moral responsibility to act. Second, it would be the first reasonably sized industrialized nation to achieve this outcome, setting an example for other countries to follow. Third, it would have achieved the result coming from a position in 2005 when 90% of electricity generation relied on fossil fuels, and in a circumstance where ample ‘cheap’ fossil reserves are still readily available. And finally it would debunk the widespread myth that 100% renewable electricity is just wishful thinking.
There are many dimensions to Queensland’s energy and jobs plan including transitioning workers, hydrogen hubs, repurposing coal plants, and the role of residential solar. But I want to focus on a couple of key enablers for renewable electricity expansion – the provision of adequate energy storage and transmission capacity. These enablers will unlock the long pipeline of private investment interest in large-scale solar and wind projects in the country.
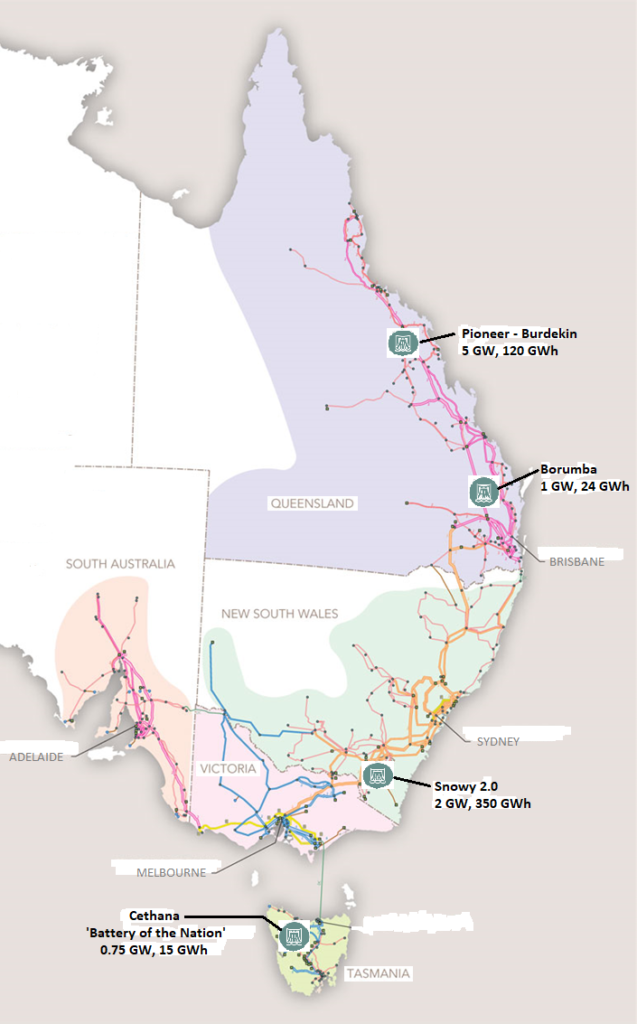
The map shows the high voltage transmission system of the Australian National Electricity Market (NEM), together with the sites of announced major pumped hydro energy storage projects. The two significant Queensland storage projects are the Pioneer-Burdekin and Borumba schemes.
The spread of storage projects from north to south covers around twenty degrees of latitude, equivalent in the northern hemisphere of traversing from northern California to central Mexico, or from Spain to mid-Sahara.
This diversity of geography ensures that at any one time reasonable wind generation should be occurring somewhere in the country. To get a similar benefit from solar would require greater east-west diversity which is possible if Western Australia was eventually connected to the NEM.
The map shows a backbone of major pumped hydro storage sites along the east coast, the most significant being Snowy 2.0 which is located between the major load centers of Sydney and Melbourne.
Before we look at some numbers, it is important to understand that there are three factors which influence the value of energy storage, and here you need to pay attention to the units of measure.
First is the dispatchable capacity of the storage scheme. This defines how many watts of electricity can be instantaneously released from the storage to meet demand. For example, the Borumba project is intended to have a capacity of 1000 megawatts (MW) or 1 gigawatt (GW), which is the size of an average coal-fired power station. In the media this is often reported as the demand of so-many thousand homes.
The second factor is for how long this output can be sustained. In the case of Borumba, it is intended to provide up to 24 hours of output, which translates into a nominal storage capacity of 1GWx24hours = 24 gigawatt-hours (GWh). The longer the time-capacity, the more ‘firm’ and reliable is the electricity supplied. One of the advantages of pumped hydro systems is that they usually provide much more storage time than batteries and are more cost effective.
Finally it is important that the transmission system is capable of receiving the output from the storage and transmitting the electricity to the demand centers. This is where smart investment in ‘unsexy’ transmission lines is important.
How do we know how much storage is required? In 2017 researchers at Australian National University carried out detailed modelling to answer exactly this question. They found that a total storage of the order of 400 to 500 GWh was required together with a combined dispatchable capacity of around 16GW.
How do the projects on the map compare with these requirements? When combined, they sum to a storage capacity of 509 GWh, meeting the modelled target, and an output of nearly 9 GW which is shy of the target. But this doesn’t count sub-GW pumped hydro projects of which there are several in development and more to come. Further it does not include the 1 GW of battery capacity already installed and the pipeline of 26 GW of battery projects. Of course, appropriate location of storages, batteries and the extension and upgrade of transmission lines is important for achieving the target outcome.
The latest date for the four major storage projects shown on the map to be up and running is 2032, with by far the largest, Snowy 2.0, already under construction with an anticipated start-up date of 2026.
Of course there will be challenges as we progress. Engineering and economic hurdles need to be met. Actual renewable generation projects have to be built, and in the optimum locations. And importantly, environmental effects need to be acceptable, noting that pumped hydro needs only top-up water to account for evaporation and other losses as water is constantly recirculated by pumping from the lower impoundment and then releasing from the upper one.
This announcement from the Queensland Government demonstrates that when governments show commitment and initiative, significant change can be achieved. This is good news in the battle against global warming. Let’s advocate for other governments to follow suit in ways tailored to their own situations.
The writer is a co-author of Court of the Grandchildren, a novel set in 2050s America.
Main image credit: Mustachioed_Pizza at Pixabay